2020 Drug Data Trends & National Benchmark Report
Your go-to resource: the 2020 TELUS Health Drug Data Trends & National Benchmarks report.
Private drug plans saw the biggest increase in overall eligible costs in 2019 compared to the previous four years, according to the 2020 TELUS Health Drug Data Trends & National Benchmarks report. While specialty drugs were a driving factor, traditional drugs also played a key role. Year-after-year results also continue to reflect an important evolution in drug therapies, with a focus on targeted medications that can significantly improve health outcomes.
The report presents major trends in private drug-plan costs and utilization, as well as adoption rates of plan design tools such as mandatory generic substitution and managed formularies. The data for 2019 were extracted from the TELUS Health database of more than 13 million insured individuals, who transacted more than 150 million prescription drug claims.
TELUS Health thought leaders Shawn O’Brien and Jason Kennedy provide analysis as well as recommended actions for plan sponsors and benefits providers.
The report is divided into four main sections: costs and utilization; drug plan design tools; specialty drugs; and drugs by therapeutic class. Among the highlights:
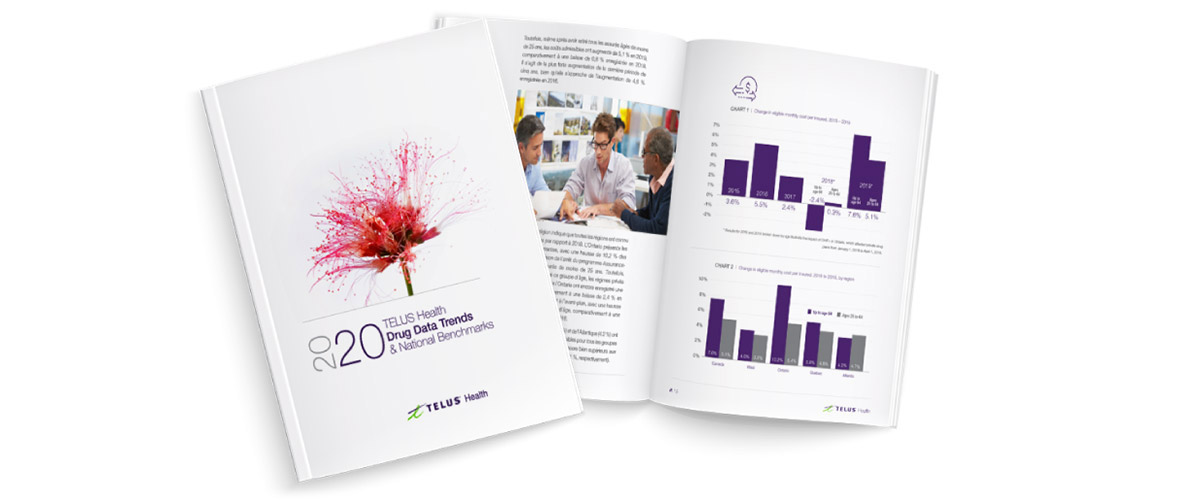
- The eligible monthly cost per insured increased 7.6% in 2019, compared to a decline of 3.6% in 2018.
- Ontario’s OHIP+ program, which removed insureds under the age of 25 in that province from the book of business for all of 2018 and the first three months of 2019, certainly had an impact. Eligible costs jumped by 10.2% in Ontario in 2019; when insureds under the age of 25 are removed, this drops to 5.4%.
- Claimants submitted an average of 10.3 claims in 2019, compared to 9.8 in 2015. The average annual eligible cost per claimant was $769.13, compared to $675.95 in 2015.
- Generic drugs accounted for 63% of prescriptions filled by private drug plans in 2019, up from 58% five years ago. The generic fill rate is highest in Atlantic Canada (70%) and lowest in Ontario (61%).
- Specialty drugs’ share of eligible costs has more than doubled in the past 10 years, from 14% in 2010 to 30% in 2019. The number of claimants, meanwhile, consistently hovers around 1%.
- Early data suggest that B.C.’s biosimilar switching policy has increased the utilization of biosimilars by private drug plan members as well.
- The top therapeutic area based on eligible costs for drugs is rheumatoid arthritis, followed by diabetes and skin disorders. Five years ago, skin disorders were ranked seventh.
- Almost two out of three claimants (65.8%) for asthma drugs are non-adherent. Asthma ranks fourth in the top-10 list of categories by eligible costs, accounting for 5.6% of costs and 5.5% of claims in 2019.
Of the plan design tools measured in the report, only one (generic drug policies, and more specifically mandatory generic substitution) saw steady gains in the past five years. The most common tools are prior authorization (89%), generic drug policies (87%) and coinsurance (69%), followed at some distance by capped dispensing fees (28%), deductibles (23%), managed formularies (22%) and annual plan maximums (21%).
See below the full results with supporting analysis.
The post 2020 Drug Data Trends & National Benchmark Report. appeared first on Health Benefits Hub.